
Your solution — in numbers and on a plan
See what your assessment could look like
More than an equipment list. See a generation forecast, on-site consumption share and a panel layout to help compare options and make a decision.
Hypothetical business
Generation and consumption coverage forecast
Plant capacity
100kWAnnual generation
150MWhConsumption coverage
40%Generation throughout the year
Illustrative profile, MWh per month. Annual total: 150 MWh.
Where the business gets its energy
Solar → on-site consumption120 MWh
Remaining grid consumption180 MWh
Generation beyond on-site use: 30 MWh
Example: demand is 300 MWh/year; 120 MWh of solar generation is used on site and 30 MWh is surplus. The generation profile is illustrative, not an engineering calculation.
Economics for your agreement
Your proposal compares costs before and after the project, the system price or energy service terms. We explain the impact of tariffs, maintenance and surplus generation.
Assumptions in plain sight
Surplus compensation, indexation and maintenance affect the outcome. We record these in the assessment and agree them before the contract.
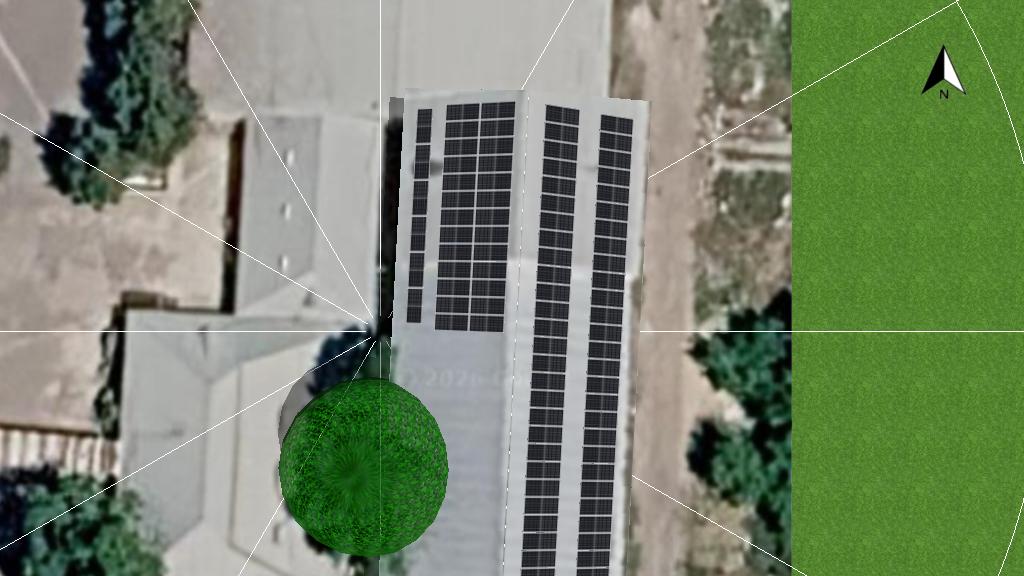
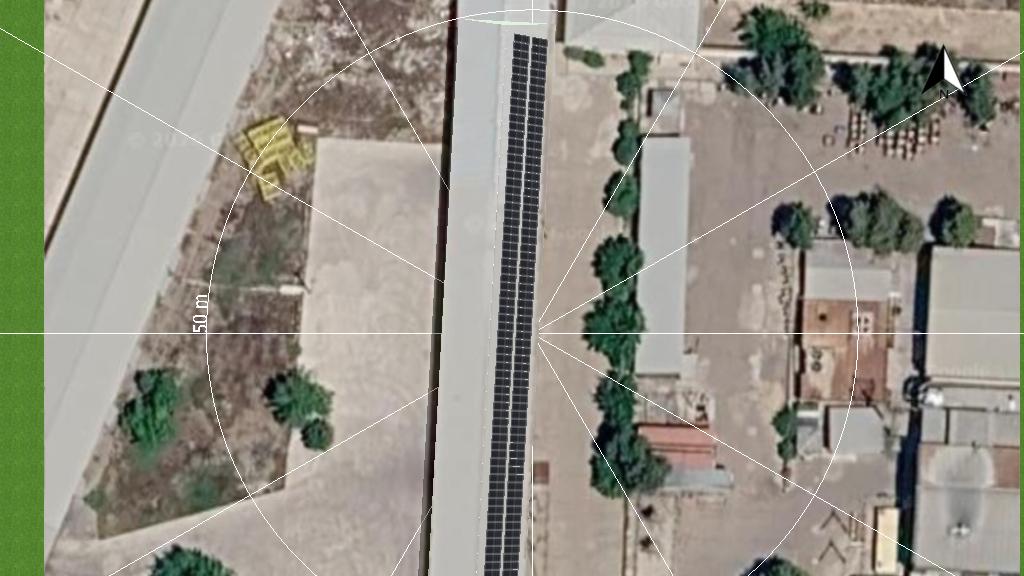
Panels — on a plan of your site
Extracts from preliminary layout models on satellite imagery. They illustrate the technical appendix format and are separate from the illustrative figures above. Installation feasibility requires a site assessment.
Request an assessment for my site
Start with your site location, operating hours and priorities. We will discuss the assessment scope and the data needed.
Use the arrows or swipe to explore
How we arrive at a solution
 01020304
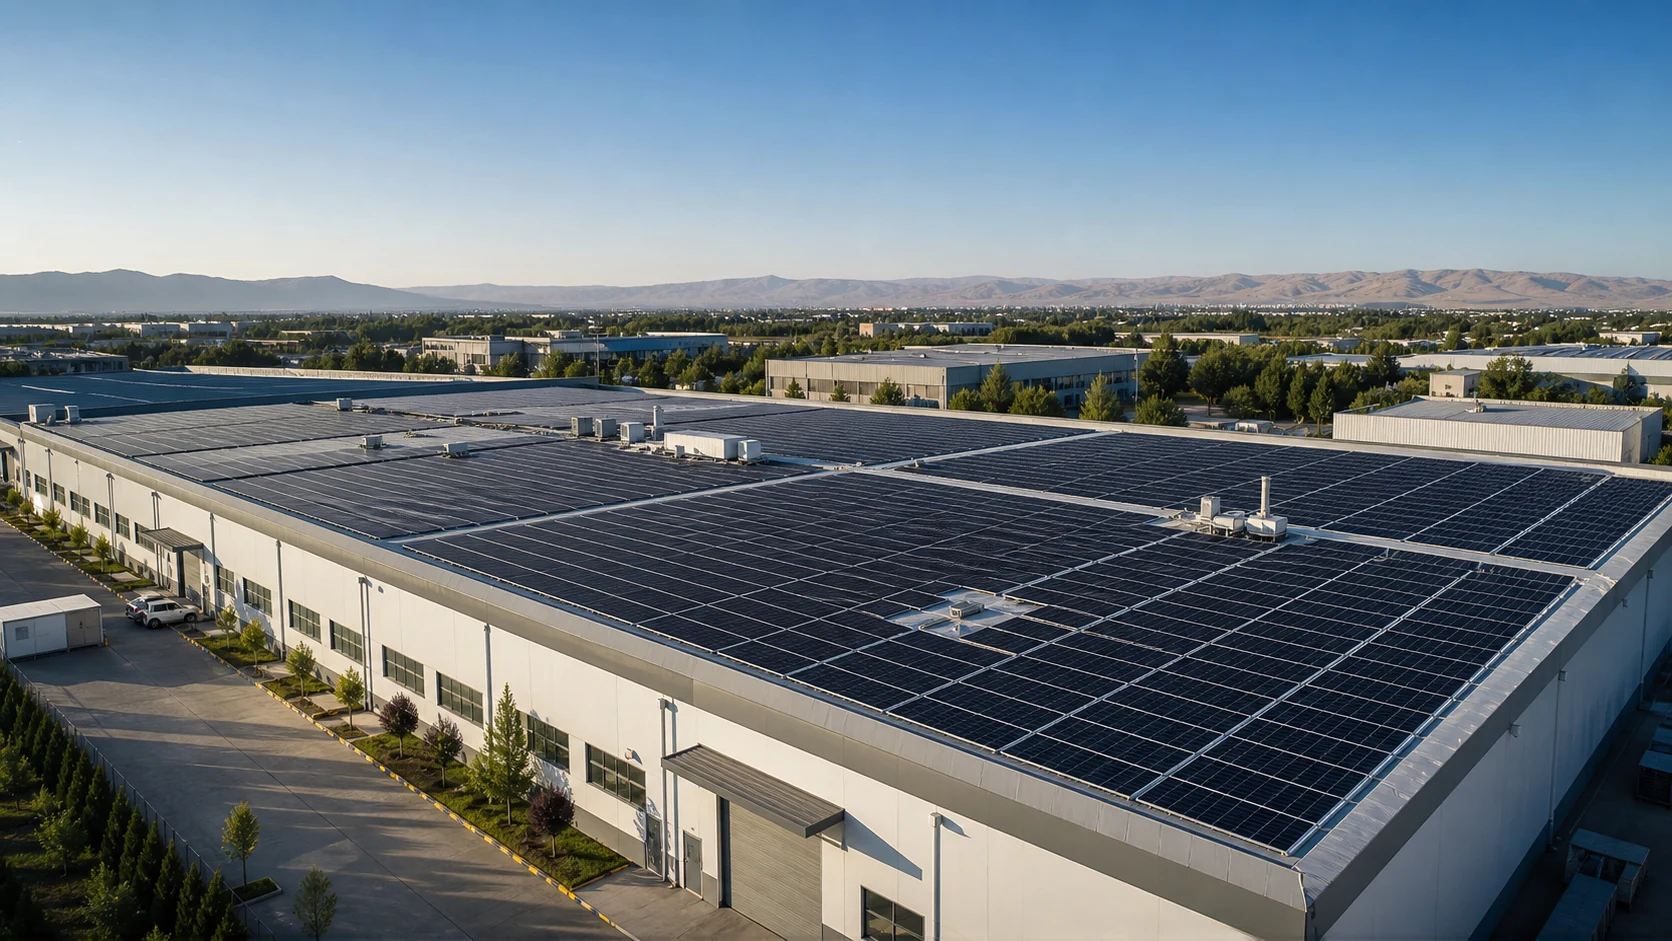
Illustrative scenario. The photograph illustrates solar generation; the models show preliminary layouts. Capacity, economics and backup are assessed for each actual site.